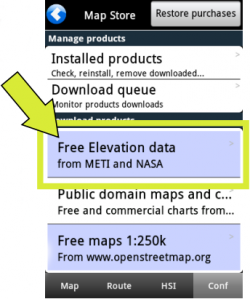
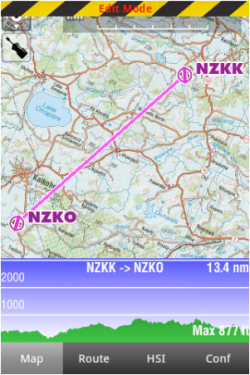
From the «Map Options» menu, you can turn on the Elevation Graph. If elevation data is installed for your region, the elevation graph will display terrain information. Note that you will show data information ONLY after downloading «Free Elevation data» files from the Map Store.
In «Flight mode», the Elevation Graph will display the terrain in front of the aircraft, updating the view every 5 seconds. The maximum reported altitude of the total distance of terrain profile in front of us will be displayed in the Graph. We can zoom in or zoom out by using two fingers to see less or more terrain. The scale is displayed in NM. A symbol representing your aircraft will show in the view with a red dashed line, representing your current altitude, as reported by the GPS.
This is very useful when planning your route, to get an estimate of the minimum safe altitude.
Note: Please note that even with a good GPS signal, the altitude as reported by the GPS may have an accuracy of +/- 200 ft. Elevation database may also contain some inaccuracies. You should always plan your flight with a reasonable margin over the obstacles.
Back to index.

